Overview
Partial response on second-line treatment.
Metastatic melanoma, BRAF V600E, with disease in the liver and one lymph node. Encorafenib with binimetinib since 9 June 2026, after progression on ipilimumab and nivolumab. Tumour DNA, LDH and all measured lesions have fallen since June.
Personalised tumour DNA
Mutant molecules per mL of plasma (MM/mL), log scale. Tumour-informed panel of 24 variants selected from whole-genome sequencing of the 2025 primary and the 2 Jun 2026 liver biopsy.
Resistance surveillance
Proposed criteria for an early CT before the scheduled scan. Any criterion met: CT chest, abdomen and pelvis within 2 weeks. Next blood draw 17 Nov 2026.
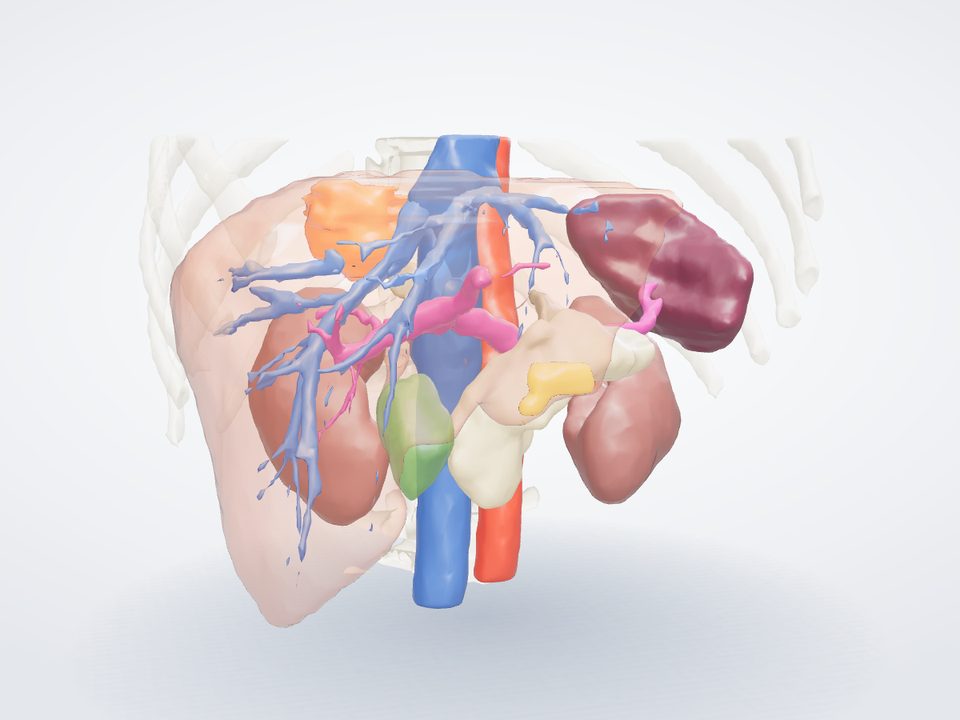
Liver, liver veins and the two lesions from the expert outlines of the CT of 8 Jan 2026; bones, kidneys, spleen and great vessels by automatic segmentation. The model loads after the rest of the page and pauses when scrolled out of view.
Contrast CT of 8 Jan 2026, portal venous phase, 2.5 mm slices; outlines from the expert segmentation.
Liver, lesions and veins traced from the CT; other organs drawn for orientation.
Sites
Contrast CT of 12 Oct 2026; volumes against the baseline CT of 8 Jan 2026.
Diagnosis in March 2025 to 2 Nov 2026. Each bar and marker has a tooltip with details.
Molecular profile
Whole genome of the 2025 primary and the 2 Jun 2026 liver biopsy with matched blood; RNA of the liver biopsy.
Cancer cell fraction
Expression against 469 cutaneous melanomas, percentile
Safety status
Highest CTCAE grade of each side effect by month, 2026. Hover a cell for the detail.
Sum of target lesion diameters
RECIST 1.1 on five CT scans in 2026. Dashed lines: partial-response threshold, −30% against each line's baseline (68 mm for line 1, 58 mm for line 2).
Partial response on second-line treatment: −39% by RECIST against the scan of 2 Jun 2026 (83 to 51 mm) and −79% by lesion volume. Tumour DNA 0.2%, LDH and S100B within their reference intervals.
Not assessed
Next ten weeks
Scans, decisions, treatment cycles, blood tests and safety checks from 2 Nov 2026. Select a marker for the detail.
Decision map for the tumour board
Tumour board, 12 Nov 2026 13:00.
Trial eligibility
9 trials screened against the record. One dot per eligibility criterion; hover a dot for the criterion.
Treatment and response
Initial response to ipilimumab with nivolumab was followed by progression. Tumour DNA, LDH and lesion volume have fallen since encorafenib with binimetinib started on 9 June.
Changes last 30 days
Each finding is assessed against licensed treatments and published evidence. Levels follow ESCAT; I-A denotes benefit proven in randomised trials in this cancer. Levels are assigned only to findings linked to a treatment.
Position of each change in its protein. Grey stems: changes recorded in other melanomas in the reference set. Larger orange markers: changes in this tumour.
Changes in cancer genes liver biopsy 2 Jun 2026, compared with the 2025 primary and blood
Bars show the share of DNA reads carrying the change (VAF). Cancer-cell fraction is the share of cancer cells that carry it, after allowing for normal cells in the sample.
Copies of each part of the genome in the cancer cells, chromosomes 1 to 22. Two copies is normal. The lower line is the number of copies of the less common parent's chromosome; where it falls to zero, one parent's copy has been lost (loss of heterozygosity).
Treatment-relevant genes copies in the cancer cells
Structural variants whole-genome sequencing
Chords join the two broken ends of each rearrangement over 1 Mb. The inner ring shows copy number.
Fusion screen DNA breakpoints and RNA reads
Treatment-relevant fusions, screened in both the genome and the RNA.
Genes disrupted by a rearrangement
Tumour mutational burden mutations per Mb
Microsatellite instability
Homologous recombination
Mutational signatures 96 trinucleotide contexts · liver biopsy
The pattern of single-letter changes indicates the source of DNA damage. Each bar is one change in the context of its two neighbouring bases.
Clonal phylogeny
Derived from the cancer-cell fractions of 41,590 mutations in the primary and the liver biopsy.
Primary against liver cancer-cell fraction
Each dot is a mutation. Mutations present in every cancer cell of both samples are at the top right.
Synthetic results for the example patient. Somatic findings are reported by an accredited laboratory, and treatment decisions are made by the treating team.
Mutant molecules per mL of plasma (MM/mL), averaged across the panel, with tumour fraction on the right axis. CT dates are marked. Each point has a tooltip with the draw; selecting a point lists its variants below.
All blood draws with input and load. Selecting a row lists its variants below.
Fitted slopes log scale
Response kinetics
Share of tumour DNA from each clone. The PTEN subclone expanded during progression on immunotherapy from April to June and is now below detection.
Variants tracked in the blood selected from the tumour genome
Panel design
Synthetic results for the example patient. A rise in tumour DNA is interpreted with scans and clinical findings, not in isolation.
Images: a real, de-identified CT from a public collection in The Cancer Imaging Archive (Simpson et al., doi:10.7937/QXK2-QG03), CC BY 4.0, shown to illustrate the viewer; dates changed, sex and age removed. Outlines of the liver, its veins and the two lesions are the dataset's expert segmentation.
Longest diameter mm · RECIST 1.1
Sum of target lesions mm
All blood results in 2026, grouped by system. H marks a result above the normal range, L below it. Each cell has a tooltip with the value and date; the i marker gives the interpretation of a change.
Dose-averaged growth-rate-normalised effect (GR) for every agent, ranked from least to most effect. Cytotoxic means cells were killed (GR below 0), growth inhibition means growth slowed, weak means little effect. Each bar has a tooltip with the drug and its target.
Each number under C1–C4 and Mean is viability: the fraction of tumour cells still alive at that dose compared with untreated controls (1.00 = no effect, 0.20 = about 80% killed). C1 to C4 are 0.01, 0.1, 1 and 10 µM. Red is little effect, blue is cells killed. IC50 (greener = more potent) is the dose for half the maximal effect.
Fitted curves with the three replicate measurements at each dose. Up to five agents can be displayed; the dashed line marks each IC50.
Viability across a 6 × 6 dose grid.
Synergy (Bliss excess)
Excess kill of the pair over that expected if the two drugs acted independently. Above 10 is strong synergy.
Each dot is one agent; the dark bar is the class median. Further left is more effect. Each dot has a tooltip with the drug.
Response predicted from the tumour DNA against response observed in the cells.
Plate quality Z′ factor
Above 0.5 is an excellent assay window.
Replicate agreement viability, replicate 1 vs 2
Controls
Synthetic results for the example patient. Ex vivo responses support, and do not replace, clinical evidence; they are read alongside the genomics and the treating team's judgement.
All measured lesions on all CT scans, segmented in 3-D and compared on the same basis. Each point has a tooltip with its values; the measure, scale and comparator are selectable.
Segmentation · baseline CT expert outline
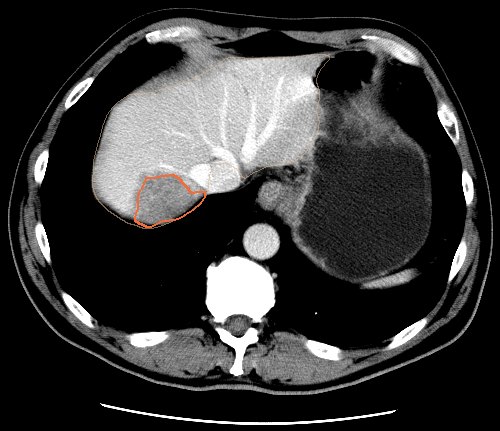
Axial slice through the lesion on the baseline CT; orange is the lesion, beige the liver. Open in the viewer
Spider plot % change in each lesion from baseline
Best response by lesion volume, % from baseline
Assessment at each scan RECIST 1.1 and volumetric
Volumes are directly comparable only when the scanner, slice thickness and contrast timing match. Amber marks an acquisition change that can alter a measurement independently of the disease.
Baseline volumes are from the dataset's expert segmentation; follow-up measurements are synthetic for the example patient. Automated volumes support, and do not replace, the radiologist's report.
RNA sequencing of the 2 Jun 2026 liver biopsy. Each gene is ranked against 469 cutaneous melanomas (percentile) and compared with normal skin (log fold change). Genes can be filtered by family or searched by name. Selecting a gene opens it in the gene viewer above.
Footprint scores from the expression of each pathway's target genes. Right is more active than other melanomas.
Estimated cell mix from the expression profile.
Primary 2025 → liver 2026 log2 change, selected genes
Interpretation
Synthetic results for the example patient. Expression is measured in bulk tissue, a mix of tumour and normal cells.
Doses today
Selecting a dose marks it as taken.
By medicine
Interaction map tooltips on medicines and genes
Interaction details
Pharmacogenomics for current medicines Full results in Germline →
Synthetic medication record for the example patient. Interaction and pharmacogenomic checks support, and do not replace, review by a pharmacist.
Stereotactic radiotherapy plan for residual liver lesion 1, prepared for discussion at the multidisciplinary meeting if the response plateaus. No radiotherapy has been given before; no cumulative dose applies.
Isodose lines axial slice through the target
Dose-volume histogram
Linear-quadratic model. BED = D × (1 + d / (α/β)); EQD2 = D × (d + α/β) / (2 + α/β). Outputs update with the values entered below.
Synthetic plan for illustration, drawn on the baseline CT. Constraints are illustrative reference values for five-fraction liver SBRT, not a prescription.
Synthetic conversation for the example patient. In a live dashboard, messages and files are stored in the patient's secure record, visible only to people the patient has invited, with every view and change logged.
Whole-genome sequencing of blood, analysed across the genes linked to inherited melanoma and other cancers. Every gene was covered at 30× or more across all coding exons.
Variants reported
Each tumour change was tested for in the blood. A change present in the tumour and absent from blood is somatic (acquired by the cancer), not inherited.
HLA class I used for neoantigen prediction
Secondary findings ACMG SF v3.2, 81 genes
Twelve genes that affect how medicines are broken down or tolerated. The marker shows the phenotype of the patient between poor and ultrarapid metabolism.
Guidance by medicine CPIC and DPWG guidance
Synthetic results for the example patient. Germline findings are confirmed by an accredited clinical genetics laboratory before they guide care, and genetic counselling is offered.
Both tablets are taken every day. Each square is one day; the dots are the doses. Each day has a tooltip with details.
Change from the start of each line, by week. The fall on line 2 is greater than on line 1 and is continuing.
Highest grade in each month. Immune side effects occurred on line 1; skin, muscle and blood-pressure effects on line 2.
Synthetic treatment record for the example patient. Options are for discussion with the treating team; the tumour board decides.
All recruiting trials are checked against the record weekly. Each step excludes trials for which the record is ineligible.
Each column is a trial, each row a fact from the record. Each mark has a tooltip with the exact criterion.
The trials shown are invented examples for the synthetic patient. In a live dashboard the matcher searches the trial registers weekly; final eligibility is always decided by the trial team.
NEWS2 adds points for each reading outside its normal band.
Reported each Sunday in the app, graded 0 to 3. Each cell has a tooltip with the note.
Synthetic home readings for the example patient. Home monitoring supports, and does not replace, the treatment team's advice: in an emergency call 999.